Welcome to the 401k Bull Market Review. Here we’ll provide a summary of the major events affecting the market today and dive into technical analysis of key ETFs in your 401k portfolio. Our goal is to help you make informed decisions and understand the key levels to watch for the next period.
Market Overview:
Today, the major stock indexes saw a significant sell-off, with investor sentiment dampened by a combination of factors:
- Global Economic Concerns: Renewed fears of a slowdown in global economic growth, particularly from China, have weighed heavily on investor confidence. Reports suggest weaker-than-expected data on industrial output and exports from China, a major global economic player, contributing to the market downturn.
- Rising Bond Yields: Treasury yields have continued their upward march, causing concerns over higher borrowing costs and the potential for slowing economic activity. Investors are cautious about the impact of higher yields on corporate profits, particularly in the tech sector.
- Geopolitical Tensions: Escalating geopolitical concerns, especially in Eastern Europe and the Middle East, are keeping the market on edge. The uncertainty surrounding these regions has led investors to move towards safer assets.
- Earnings Reports: A mixed batch of corporate earnings reports, with some companies missing revenue expectations, has added to the bearish sentiment in the market.
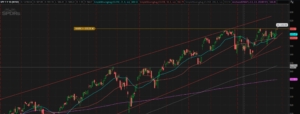
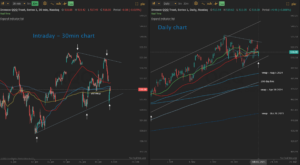
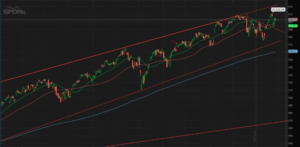
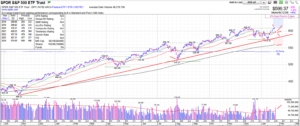
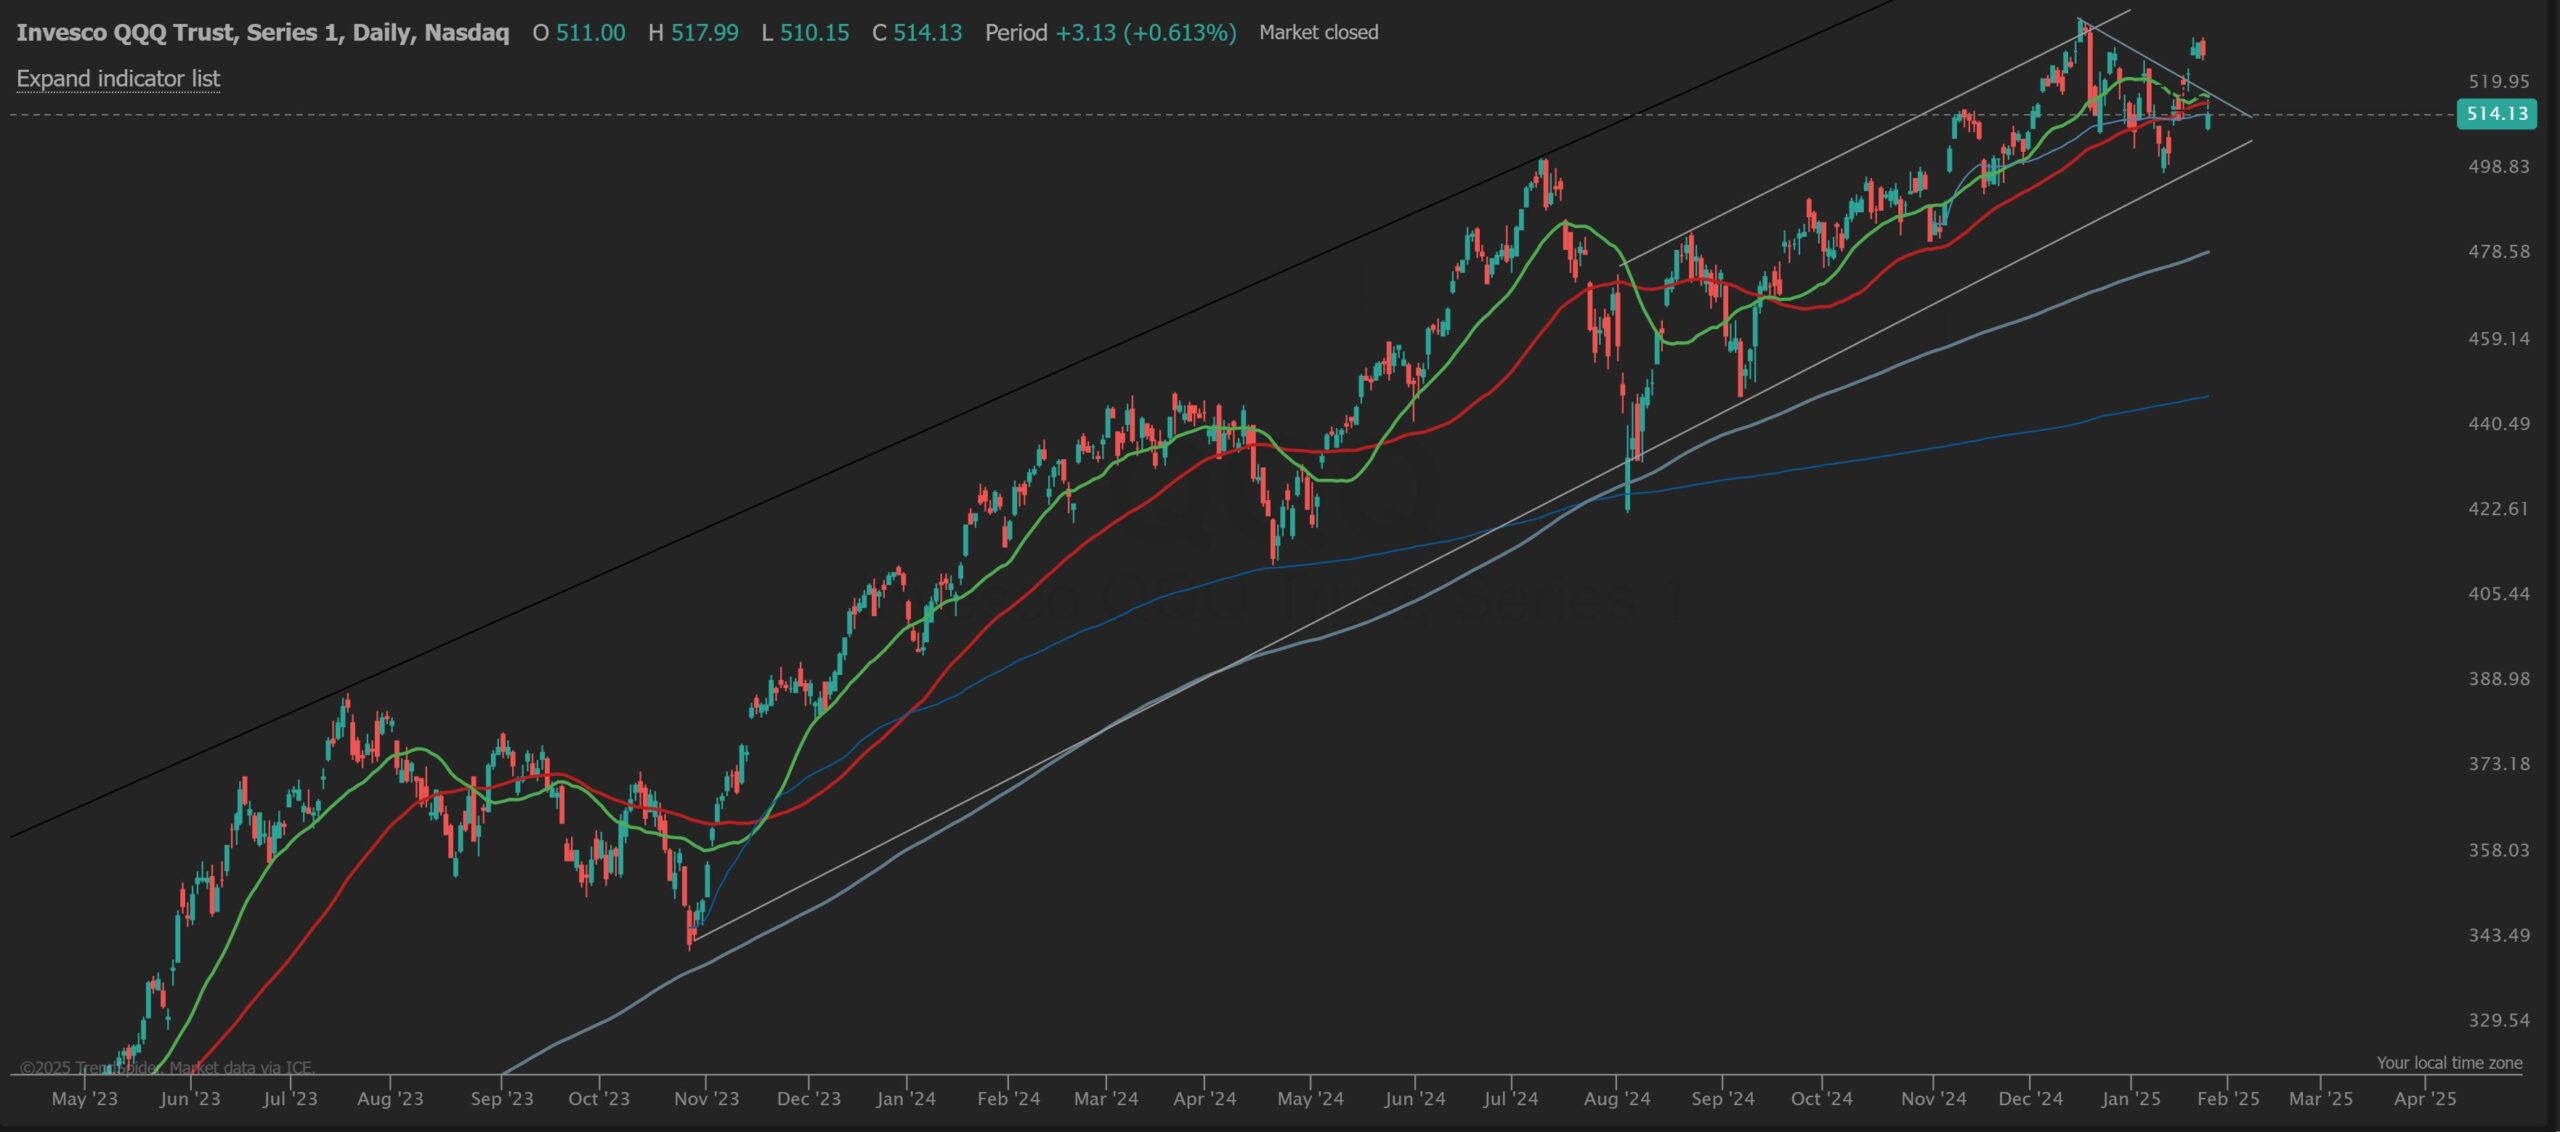
QQQ (Nasdaq 100 ETF) Technical Analysis: Close: 514.21, down –2.91%
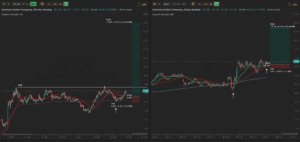
- Key Takeaways: The QQQ experienced a sharp sell-off today, closing significantly lower at 514, down nearly 3%. This marks a continuation of the downward pressure seen in big tech stocks, which led the broader market lower. The ETF also opened with a noticeable gap down, indicating heightened selling pressure from the start of the trading day.
Support and Resistance Levels:
- Support: Despite the sell-off, the QQQ is still holding above the 200-day moving average, which remains in an uptrend. This level, currently around 505, will likely act as a key support area. If it breaks below this, we could see further downside toward 495 or the next major support around 485.
- Resistance: The ETF has now closed **below the 10-day, 21-day, and 50-day moving averages, all of which are now likely to act as resistance zones. With the 50-day moving average just above 525, it will be a key level to watch for any potential recovery rally. If QQQ can break back above this level, it could signal a short-term reversal.
Volume Analysis:
- Volume: Volume was 100% higher than usual today, signaling a significant increase in selling activity. This type of volume on a down day typically indicates strong distribution, suggesting that institutional investors might be offloading positions. Given that this volume surge occurred alongside a gap down and a close below critical moving averages, it points to a shift in market sentiment, with more downside risk in the near term.
Technical Indicators:
- RSI: The Relative Strength Index (RSI) has dropped into oversold territory, signaling that the ETF may be due for a short-term bounce. However, the increasing volume and the sell-off across big tech names suggest the pullback could continue in the short-term before any significant recovery.
- MACD: The MACD (Moving Average Convergence Divergence) remains in bearish territory, reflecting continued downward momentum. A potential cross back into positive territory would be needed for a sustained bullish reversal, but at present, the technical picture is skewed towards further downside.
Outlook:
The QQQ index is in a precarious position following today’s sharp decline. The break below the 10-day, 21-day, and 50-day moving averages, combined with higher-than-usual volume, suggests that the selling could continue in the short term. The 200-day moving average remains an important support level to watch, but if it fails to hold, a deeper pullback could be on the horizon.
Short-term traders should be cautious, as the ETF faces significant resistance at the moving averages. Long-term investors, on the other hand, may want to monitor for potential signs of stabilization or a reversal near the 200-day MA.
Conclusion:
Markets are experiencing volatility, and it’s important to keep an eye on key support and resistance levels for the ETFs in your 401k portfolio. While technical analysis suggests there could be short-term opportunities for rebounds, the broader market environment remains uncertain, driven by global economic pressures, rising yields, and geopolitical tensions. Be sure to monitor these levels and stay informed as we navigate through this period of uncertainty.