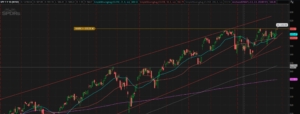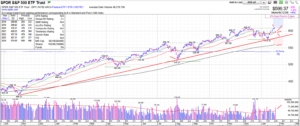
The S&P 500 is exhibiting a classic head and shoulders pattern on the daily chart since election day 11/6/2024, a bearish indicator that suggests a potential trend reversal.
We are starting to see declining 50 day sma and price is still below 50 day line on a low volume positive session. Past 4 sessions before that were negative.
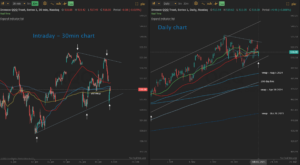
QQQ Nasdaq looks quite similar but slightly stronger being above 50 day sma line after reaching 20,000 points in Dec 2024, still if broken can see much more to the downside.
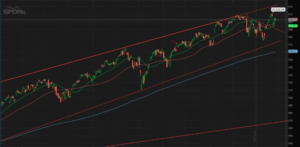
Dow looks the worse of the pack after reaching big milestone of 45,000 pints but is down to important trendline, if broken can see first support at 40,000.
This pattern typically triggers a sell-off when the price breaks below the neckline, currently sitting around 5,850. If this support level gives way, we could see a decline to the calculated target of 5,600 ( Down -5% )
Adding to the bearish outlook, several warning signs are flashing red:
- Overvalued Market: Valuations are reaching extreme highs, making the market susceptible to a correction.
- Overbought Conditions: Technical indicators are signaling overbought conditions, suggesting that the upward momentum is waning.
- Weakening Breadth: Market breadth, as measured by the advance-decline ratio, remains weak, indicating that fewer stocks are participating in the rally.
- Dow’s Downward Streak: The Dow Jones Industrial Average recently experienced its longest streak of down days since the 1970s, another sign of underlying weakness.
Trading Strategy:
For swing traders, the current strategy favors shorting the S&P 500 with stops at all time high that is few points away. However, if the index breaks out to new all-time highs, it would invalidate this bearish outlook and signal a continuation of the uptrend.
If invested in SP or Large stocks stay where you are at until trend is broken with stop loss place under if we see continuation higher gradually increase stops,
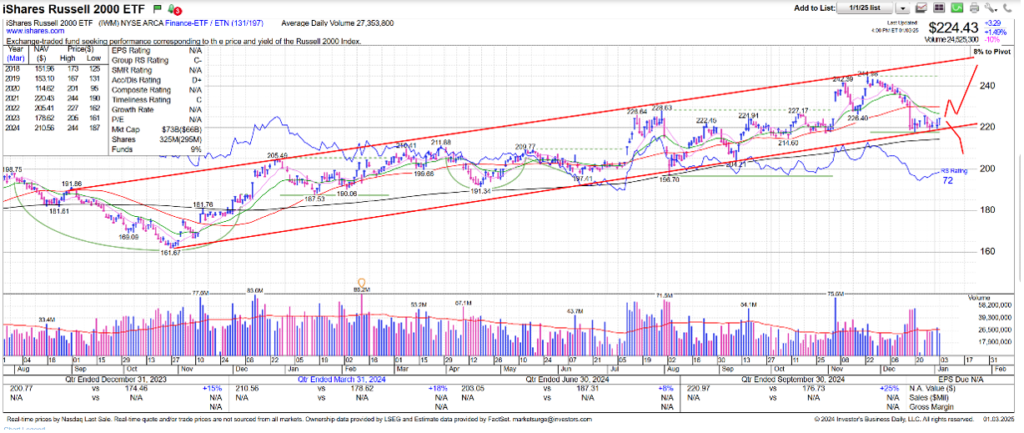
SMALL CAPS – Russel 2000 – STAY AWAY and WATCH for break up or down
Small caps are looking better from valuation point than large counterpart and are back in the trendline support, if broken we can see more continuation to the downside,
and if it holds, and black 200 day sma line holds we can see 15% rise to new level of 250
If in it hold it, if not, stay away until positive confirmation.
Action :
- IWM over 226 – Bullish
- IWM below 217 – Bearish
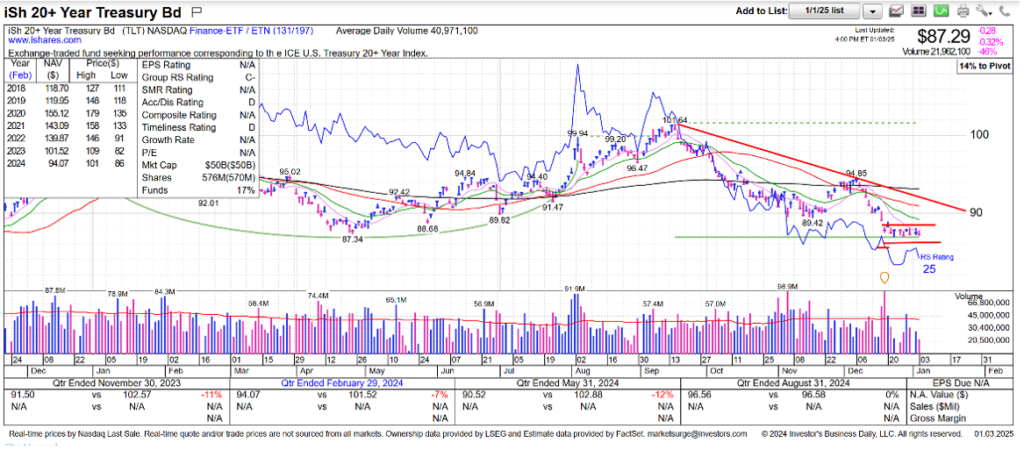
Long Bonds – stay away for now – needs confirmation for upside
Despite cutting short term rates, market is increcsing interest rates on Longer term bonds making its value going down in price. Being Long TLT and Mid term AGG bonds are still in decline due to rising long term 10+ rates, and are consolidating at this bottom for two weeks, volume is diminishing, and it can go either way, we need to see more confirmation by 21 and 50 day moving averages that are still in decline to turn to positive. Negative to Mixed message here.
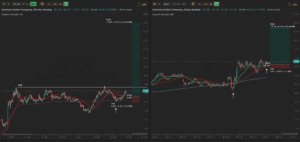
Foreign Stocks – possible BULL – Watch for Confirmation
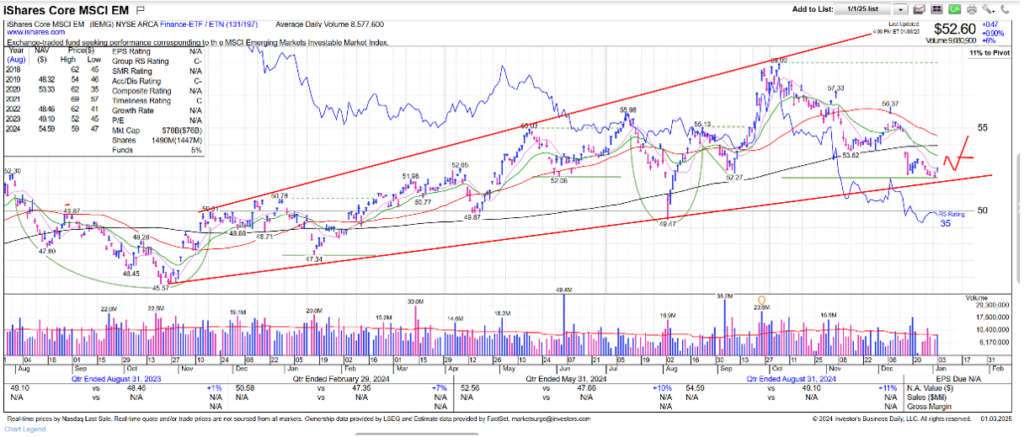
Emerging Markets look good value as they pulled back to log term trend and support line. IF tariffs with China don’t get implemented to as high level this can boost EM stocks of which China plays good part.
Below chart is long term Chart for IEMG emerging market etf showing trend since Sep 2022 low.

From technical trend analysis this is a much better-looking chart than SP or Nasdaq with a better risk return profile. Still mixed message with downside 21 day sma is down, 50 day sma is down, price is still below 200 day sma so it is possible until we see new higher low as illustrated, we don’t engage.
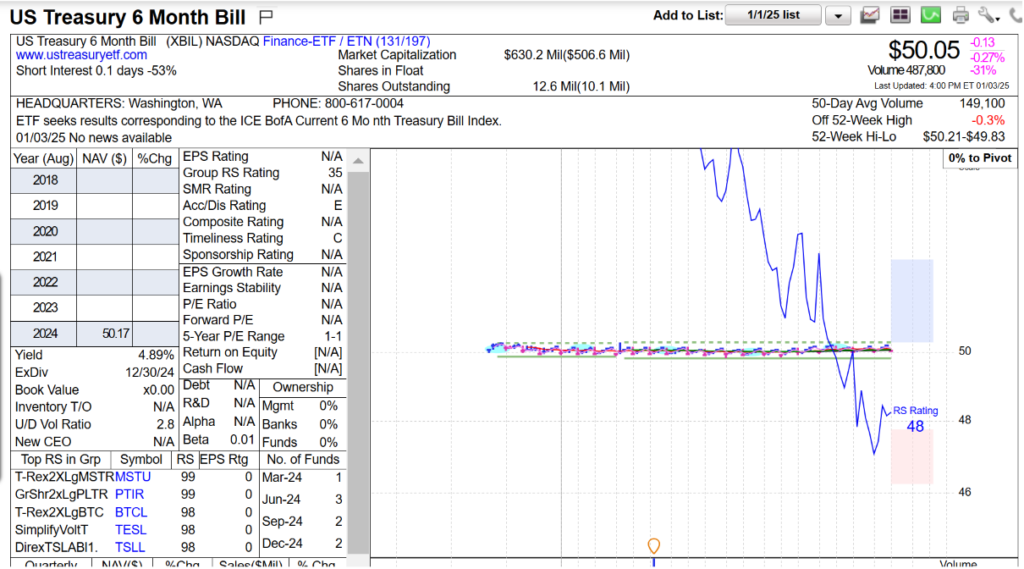
Short term BONDS – CASH IS A POSTION
Place to Be for Now – Yield 4%-4.6%
See TBIL – 3months, XBIL – 6month Treasury bonds
Contact us today to learn how we can empower you to take control of your financial future.
Register today